April 20, 2026
Market Commentary
Q1 2026
The market weakened materially in the first quarter of 2026 due to the conflict in Iran. The first-order effect of the conflict was seen in oil prices and the immediate impact on gas prices globally. The full impact on consumer spending has yet to be determined, but the potential to pressure discretionary income is undeniable. The intermediate-term effect of the conflict is the potential for higher inflation. Depending on the duration of the conflict, input prices for a wide variety of consumer goods may be negatively affected. Goods such as packaging materials, apparel, personal care goods, household goods, pharmaceuticals, and electronics all utilize oil/petrochemicals and are likely to experience at least some upward pressure in costs. The sharp increase in oil prices and inflation expectations has driven a sharp increase in short- and long-term interest rates as well, adding further pressure on economic activity like housing, business investments, and consumer loans.
On a more positive note, the labor market was volatile but has remained strong with solid non-farm payroll growth throughout the quarter. Although a strong labor market is fundamental to a strong economy and stock market, it could add upward pressure to inflation on top of the effects of oil price increases.
Turning to corporate earnings, S&P 500 earnings were generally solid, with most constituents (75-80%) beating expectations while showing an aggregate earnings growth rate of ~12%. Importantly, the magnificent 7 (Apple, Microsoft, Alphabet, Amazon, Nvidia, Meta, and Tesla) continued to show strong eps growth. Thematically, AI (artificial intelligence) stocks showed greater dispersion than in prior periods, with some of the typical beneficiaries like traditional semiconductors and utilities experiencing weakness. Weakness in these names stemmed from questions related to the durability of growth. However, other AI sectors, like semi-cap equipment and power generation-related companies, experienced strength during the quarter. More on that below.
Additionally, second-order effects of the explosive growth of AI were seen in the quarter. We wrote about the effect of AI on software stocks in the past, and during the quarter, Anthropic, a high-profile AI native company, released an update to its Claude foundation model and an application add-on called Claude Cowork. Both releases have shown dramatic improvements in software development and knowledge work productivity. Software companies took another leg down on the release and subsequent testing of these products.
From a sector perspective, Energy was the top-performing sector due to the Iran conflict and its effects on oil supply and prices. Industrials also benefited from the conflict in Iran, as defense-oriented companies like Lockheed Martin and RTX Corporation performed well. Industrials were also driven by power generation-related companies like Caterpillar and GE Vernova that benefit from the power demands of AI datacenters. Utilities and Staples were also strong during the quarter as general macro-economic concerns have catalyzed a rotation into recession-resistant sectors.
On the more negative side, the Consumer Discretionary sector was the weakest-performing sector in the quarter. As mentioned above, the rise in oil/gas prices is set to pressure discretionary spending. And a long, drawn-out conflict could be a substantially negative factor affecting consumer spending and the overall economy. The Technology sector was also weak during the quarter. The core driver of weakness was uncertainty surrounding AI-oriented spend. Hyperscalers like Microsoft (Azure) are key customers of AI hardware, and although those companies are financially sound, the ROI on their AI spend has yet to be fully determined. Companies like Nvidia, Broadcom, Microsoft, and Oracle weakened during the quarter. Also, as mentioned above, software has taken another leg down due to further disruption concerns. Communications Services also performed weakly during the quarter. Similar to Microsoft, Alphabet, and Meta Platforms are key customers of AI hardware and suffer from the same ROI on AI spend concerns.
Iran Conflict
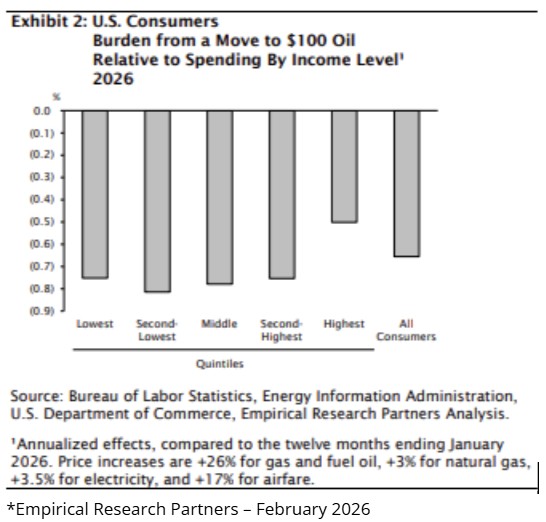
The sharp spike in oil was the dominant theme in the market during the first quarter of 2026. The primary transmission mechanism of higher oil to the broader economy is consumer spending, as consumers feel the effects of higher energy costs and later through higher goods inflation, which crowds out spending in other areas. As shown in the chart below, the sharp move in oil prices has the potential to materially pressure consumer spending.
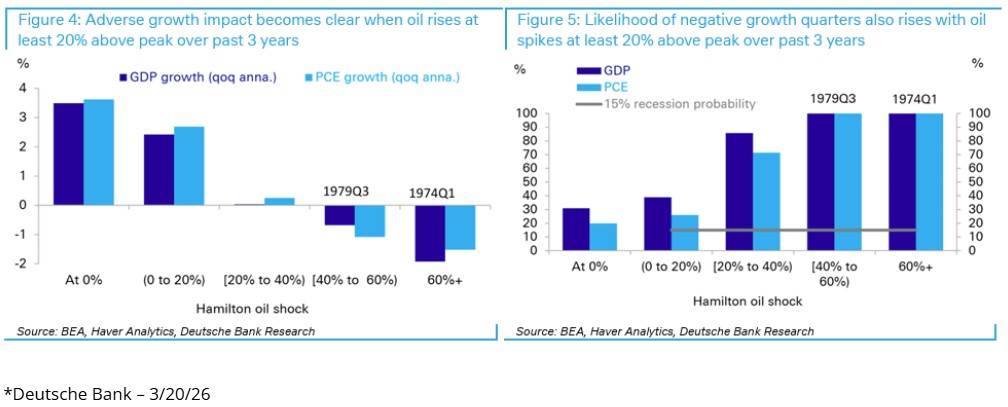
The charts below show that a sharp rise in oil prices, as we are seeing today, has historically led to weaker GDP growth and a higher probability of recession. As a result, the market has understandably started to embed macro-economic weakness into forward expectations.
Artificial Intelligence
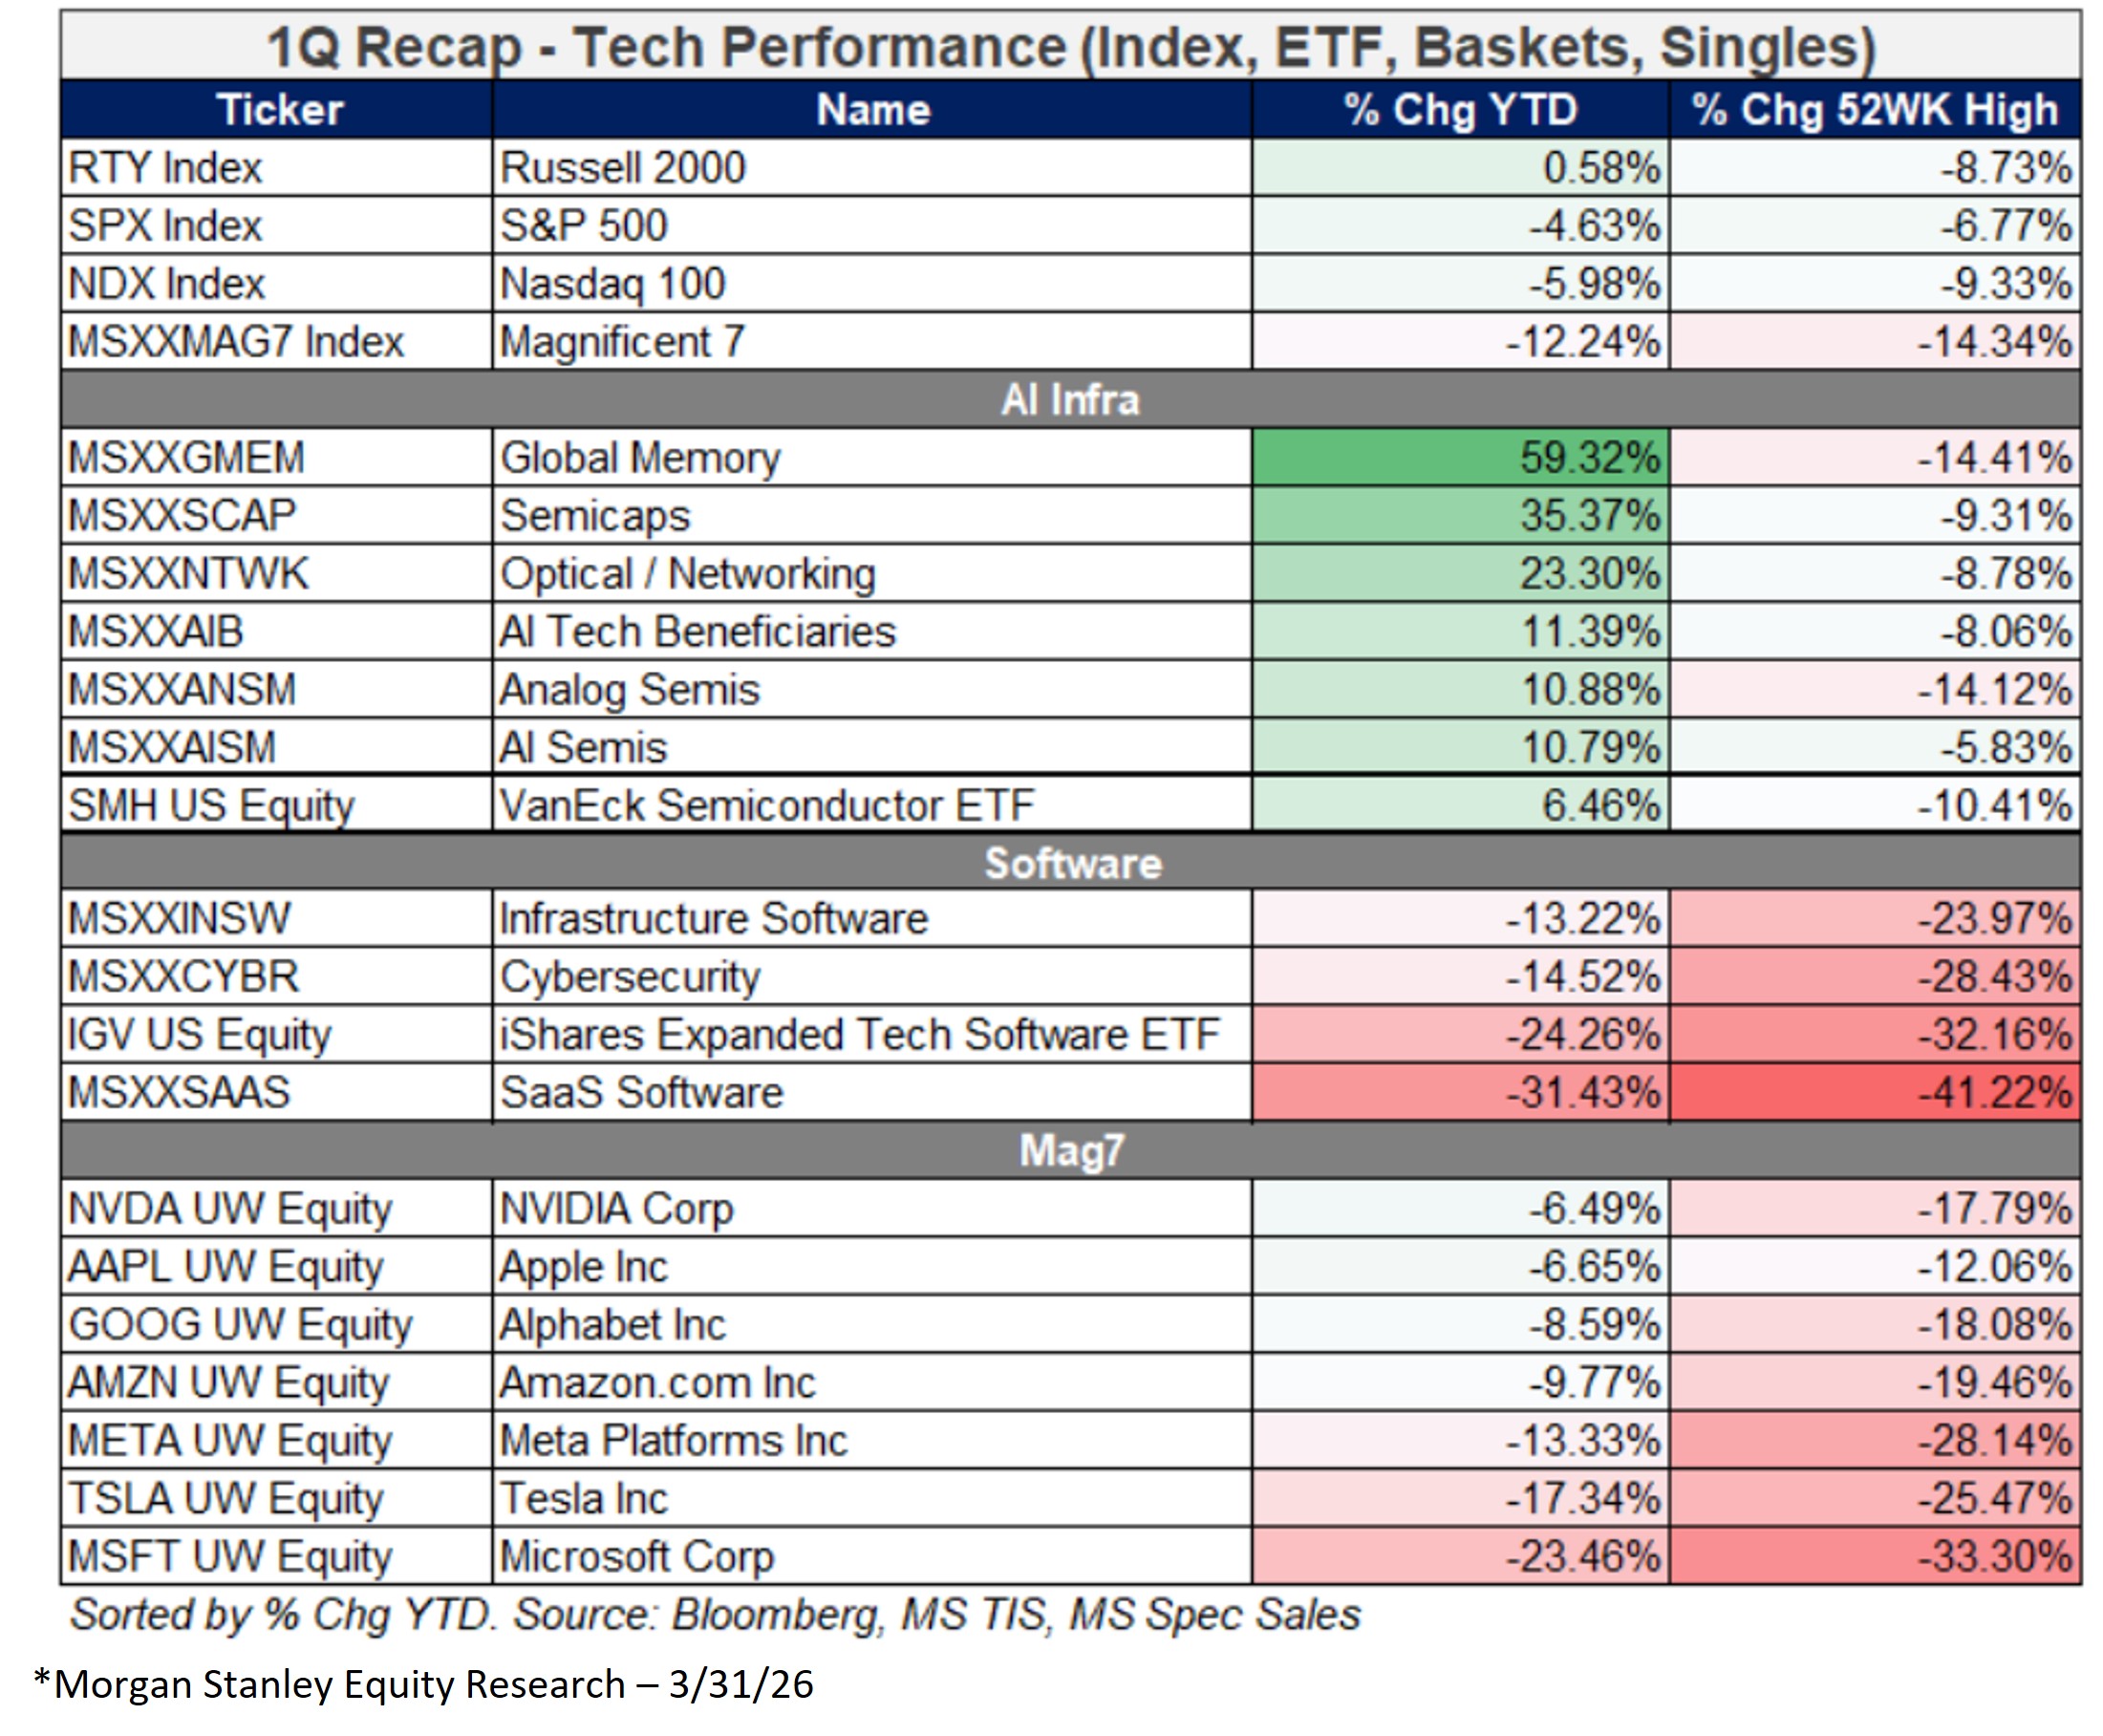
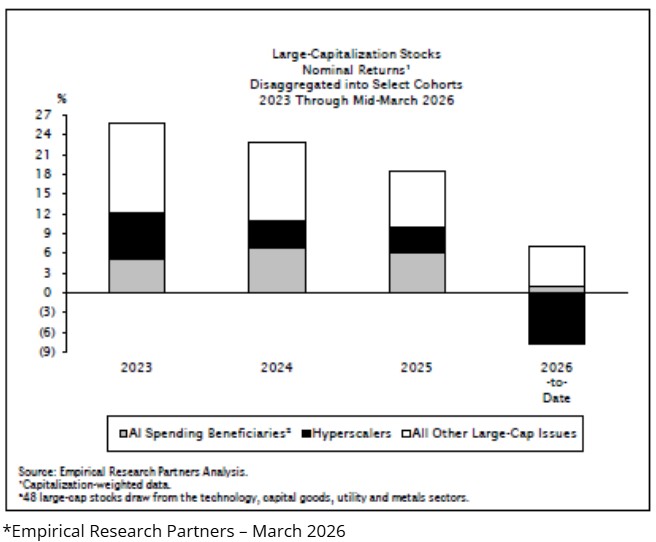
AI remains a dominant, longer-term theme in the market, but stocks in the AI bucket have started to show some performance dispersion. The table below shows the performance of various indices, ETF’s, baskets, and single stocks. And although the general trend of semiconductors outperforming software has held in Q1 2026, the performance within AI Infrastructure has shifted to Memory and Semi-cap equipment names.
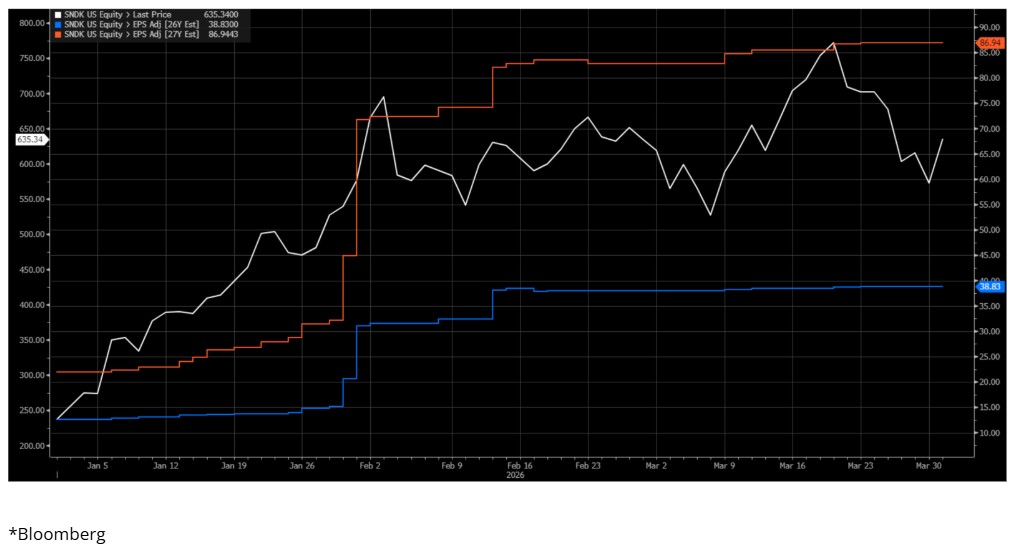
The memory sector was the standout performer in the quarter. SanDisk is one of the bellwether companies in the global memory industry, and the chart below shows its earnings revisions and stock price throughout Q1 2026. Shortages in memory created by demand from AI workloads have pushed memory pricing substantially higher than investors had expected, boosting earnings materially. For perspective, 2027 earnings expectations have gone from 22/share to 87/share in just the past few months. The stock has performed very well as a result.
SanDisk Earnings Revisions
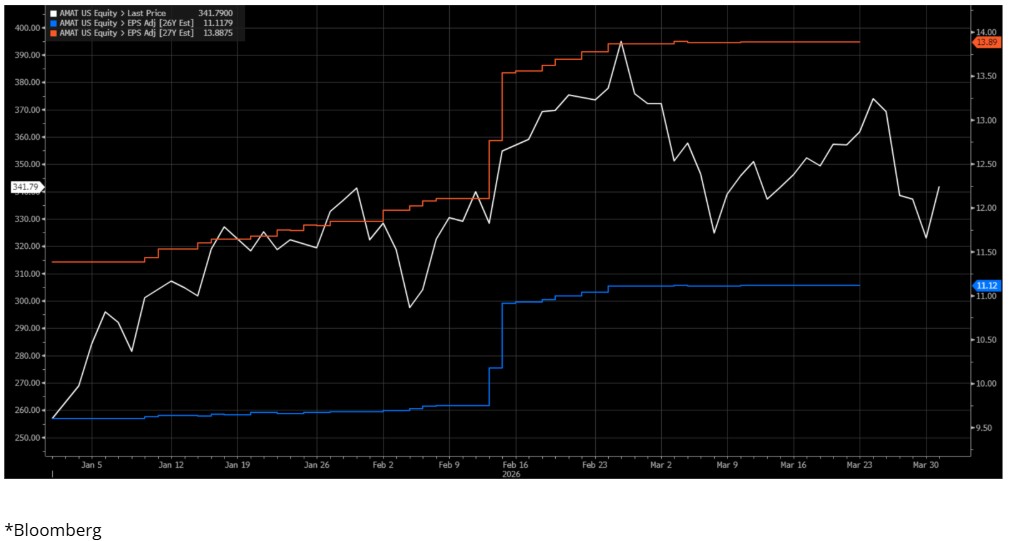
Applied Materials is the bellweather for semi-cap equipment. The chart below shows a similar dynamic where AI demand is driving better-than-expected results and outlook for the company, leading to higher earnings expectations and a higher stock price.
Applied Materials Earnings Revisions
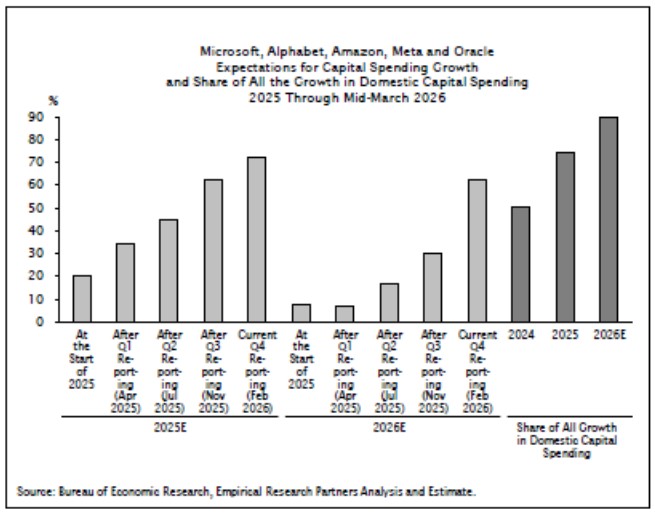
On the flip side, some of the Hyperscalers like Microsoft, Amazon, and Alphabet (Google) have had to spend more capital on AI infrastructure, driving free cash flow generation materially down. This free cash flow dynamic is the main reason why these stocks are down materially so far in 2026.
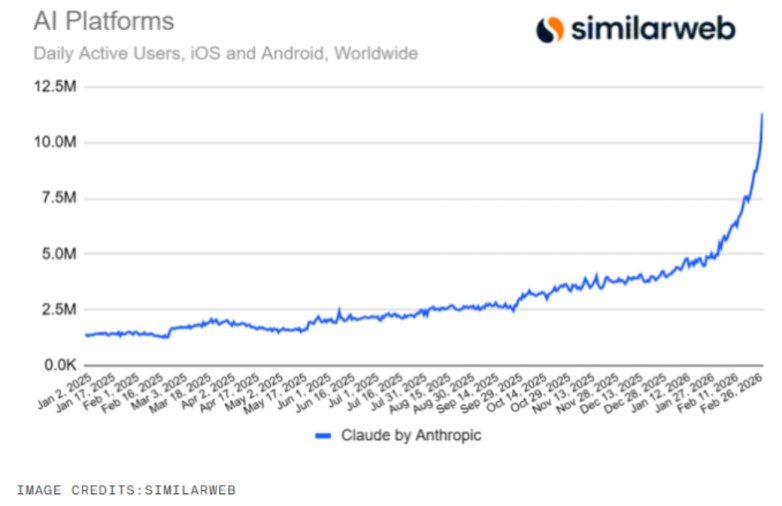
Additionally, Anthropic’s newest Claude model has been driving growth in usage and revenue but is also driving increased concerns that software will be disrupted.
Revenue Projections – Anthropic and OpenAI
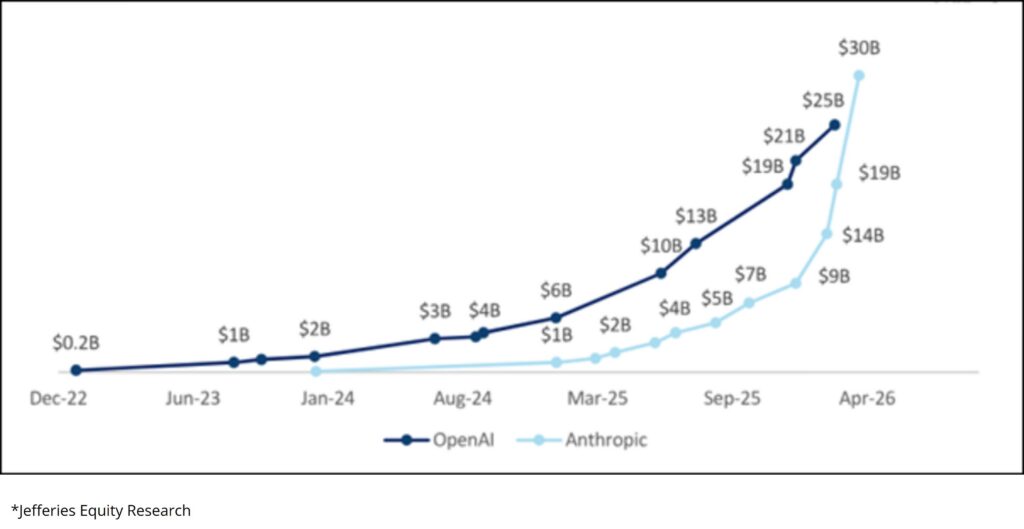
Going forward, the outlook for AI remains dynamic and nuanced. There has been tremendous growth in users and engagement with the foundation models from OpenAI, Google, and Anthropic, and we expect growth and innovation to continue. However, the overall industry is becoming more capital-intensive, with some of the leading AI companies (Anthropic and OpenAI) running operating losses and burning cash. That cash burn has been accompanied by some circular financing deals, and debt issuance to finance the build-out of more compute infrastructure. Together with weaker free cash flow at the hyperscalers, we expect concerns about ROI on AI capex to persist. However, we do believe there is tangible ROI from this spend over the intermediate to long term.
Performance Review
The Focus Fund generated a net return of -14.7% vs the S&P 500 Total Return of -4.3% during the first quarter of 2026. Our top contributors for the quarter were Vici Properties (VICI), Penn Entertainment (PENN) Sherwin-Williams (SHW), TKO Group (TKO), and American Tower (AMT). Our bottom contributors were Wynn Resorts (WYNN), Planet Fitness (PLNT), Salesforce (CRM), and Microsoft (MSFT). Given the concentrated nature of our fund, stock selection will generally be the main driver of relative performance, and in the first quarter, it was a materially negative factor in relative performance. Three of the Fund’s larger positions, Wynn Resorts, Planet Fitness, and Salesforce, provided >700bps of negative contribution to the quarterly return. And on the sector selection side, our overweight in Consumer Discretionary, which was the second worst-performing sector in the index, added further underperformance. Our underweights in some of the best-performing sectors like Energy, Consumer Staples, and Industrials were additional factors.
Top Contributors
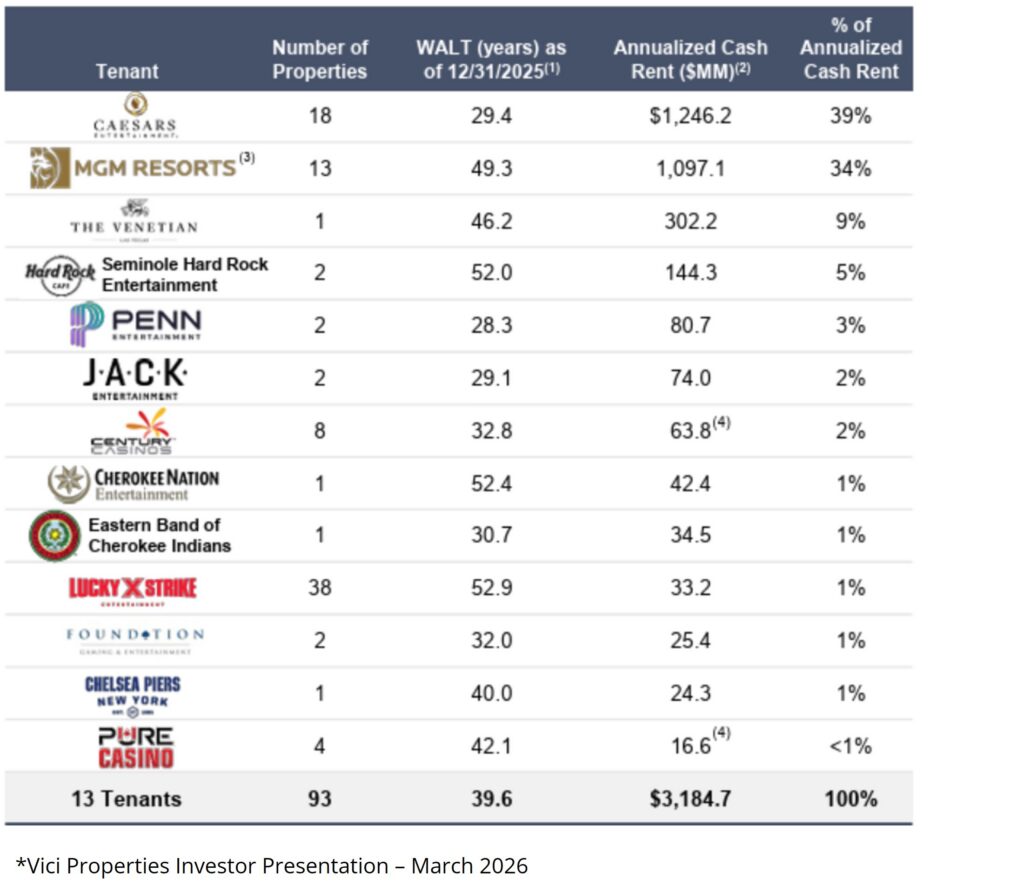
Vici Properties (VICI)
Vici Properties was the top contributor to the Q1 return, with a +7.5% increase. To be clear, we sold our position prior to the oil-driven market weakness. The reason for our sale was company specific, as one of Vici’s largest customers, Caesars Entertainment (39% of Vici’s rental revenue in 2025), has experienced weaker-than-expected fundamental performance in some of its Vici-owned properties. We have become increasingly concerned that this tenant will seek some form of rent relief, thereby lowering the revenue growth at Vici. More broadly, the Vici business model does have some defensive characteristics. Vici’s customers are generally experience-oriented, and despite the discretionary nature of that business, the rent payments to Vici are not considered at risk in a weaker economic environment. Case in point, the company’s rent revenue was virtually undisturbed during the COVID pandemic when many of Vici’s customers were closed, highlighting the critical nature of the physical property that Vici owns and rents to its customers. However, the company’s status as a REIT does have its risks in today’s environment. Reits, including VICI, hold significant debt on their balance sheets, making them especially sensitive to changes in long-term interest rates. Reits are also considered long-duration assets similar to long-term bonds, as their rental streams are generally very steady over time.
Penn Entertainment
Penn Entertainment was another top contributor to the Q1 return, with a +1.9% increase. The stock acted better in Q1 due to solid earnings results, which surprised investors in two important ways: steadier than expected land-based profit growth and better profitability in its online sports betting and iCasino business.
As a reminder, we bought the stock in Q4 25 based on our view that the fundamental trends at Penn were set to improve in both its land-based and online gaming segments. The company’s land-based operations started to experience pressure from competitive openings in early 2025. And in online sports betting, investors have been concerned that operating losses would again mount as Penn rolls out its new OSB product. For reference, in Q4 25, Penn decided to end its partnership with ESPN Bet, which was costing Penn ~150m per year in cash and stock. The termination of the deal completely removed those payments; however, Penn did relaunch its OSB business as theScore Bet.
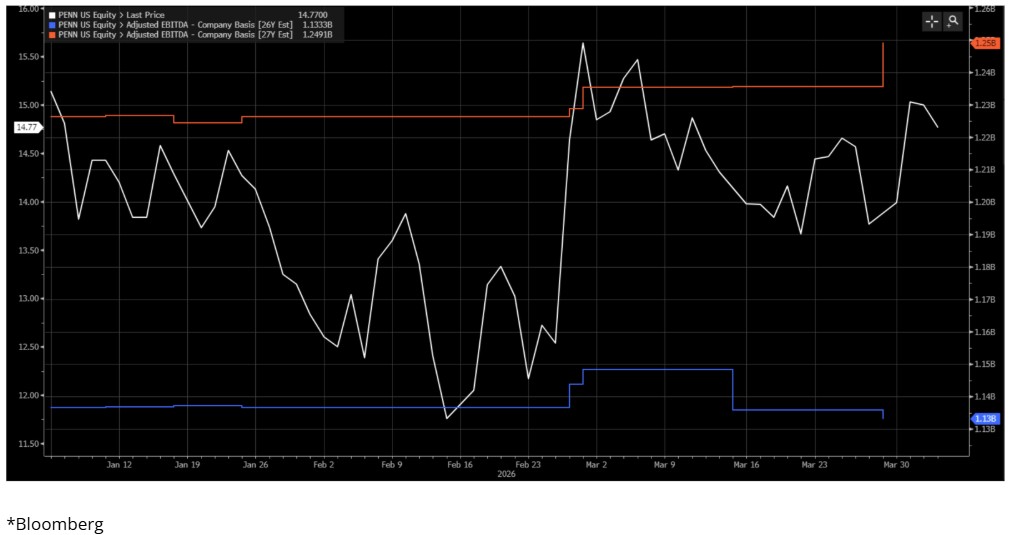
The Q4 25 earnings results helped alleviate investor concerns on both of those fronts. On the first point, although competition remains, the company appears to be showing some revenue stability/growth as those competitive openings have started to annualize. Investors are also somewhat bullish that consumers are set to receive material tax benefits from the president’s One Big Beautiful Bill Act (OBBBA). To be fair, those benefits have yet to be realized, and higher gasoline prices may act as a negative offset. Overall, property cash flow showed relatively similar growth trends to prior quarters, which was a mild positive surprise given the competitive concerns. On the second point, the company reported better-than-expected losses in its OSB segment and guided to breakeven EBITDA in 2026, which was a huge relief to investors. As a result, earnings expectations and the stock price performed better YTD.
Penn Entertainment Earnings Revisions
Bottom Contributors
Wynn Resorts (WYNN)
Wynn Resorts (WYNN) was one of our top detractors in the first quarter of 2026, decreasing 15.6%. The main driver of the weakness was the conflict in Iran. The company’s UAE facility was expected to be opened Q1 2027 but the military actions in the region have called the project timeline and return profile into question in the near to intermediate term. As seen in the table below, the estimated contribution from the UAE project to EBITDA and free cash flow is material.
Wynn Al Marjan Island Estimates
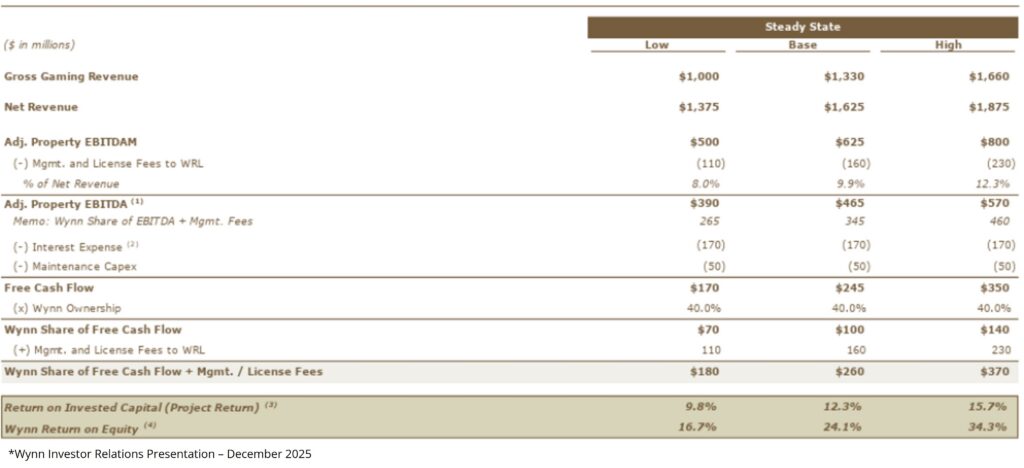
The conflict in the region is likely to have influenced the project timeline, but also may have lowered the overall demand in the region, given long-term safety concerns.
Additionally, the spike in oil prices is expected to affect demand in Las Vegas. We expect Las Vegas Strip consumers to feel the effects of higher airfare, on top of the overall impact of higher inflation on discretionary income. However, Wynn’s customer base is generally the higher-end consumer, who are less affected by gas prices and general inflation.
Overall, we are still bullish on the company’s outlook, including the UAE project. The Al Marjan Island project will be the first of its kind in the region, and given the region’s wealth/tourism and the lack of competition, we continue to expect the project to perform well versus the company’s stated expectations. Also, despite potential cyclical concerns, we maintain a positive view of the company’s high-end positioning in Las Vegas and Macau. Ultimately, we still hold the view that investors have underestimated the company’s intermediate to long-term earnings power. Wynn trades at ~8.5x 2027 EBITDA, which is a discount to its historical multiple.
Planet Fitness (PLNT)
Planet Fitness was another one of our top detractors to the Q1 2026 return, decreasing 31.4%. The stock performed poorly on weaker-than-expected FY2026 guidance on revenue and EBITDA. The company cited poor weather conditions in many of its regions during the quarter, slower new unit growth in 2024-2025, and the sale of some of its company-owned stores to a franchisee. The reasons given for the guidance are reasonable in our opinion, but the stock acted poorly due to poor communication. For reference, the company held an analyst day in November of 2025, stating that revenue growth would be in the low double-digit range, EBITDA growth would be in the mid-teens range, and eps growth would be in the mid to high teens range (see chart below). The 2026 guidance was below these ranges, suggesting that business conditions have changed dramatically over the past few months.
Planet Fitness Long-Term Guidance
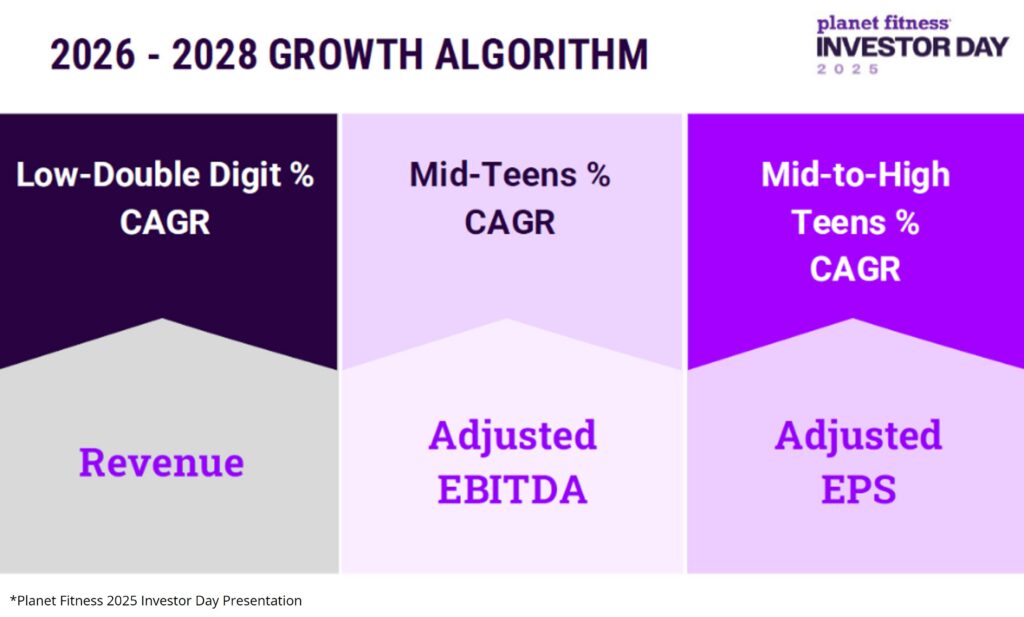
As mentioned above, we believe the reasons for the weaker guide are believable, but we were also disappointed by the communication. That said, despite the disappointment, we remain bullish on the intermediate to long-term prospects for the business as the company announced that it will be increasing prices on its higher-tier, black card membership. The company is also starting to see improved real estate availability, which has been a key bottleneck to new unit growth. Both factors are significant drivers of long-term growth, which we believe is not being fully appreciated amid the recent hiccup. As a result, we continue to like the fundamental story at Planet Fitness, and the valuation has become more attractive. The stock is trading at 11.2x 2027 EBITDA, a steep discount to its historical average.
Recent activity
Q1 2026 was once again active in terms of trading. We added to a handful of positions that had pulled back and that we deemed to be attractive from a fundamental and valuation standpoint. Our Q1 adds were Wynn Resorts, Amazon, Microsoft, and Draftkings. As mentioned above, Wynn Resorts weakened due to the conflict in the Middle East and the potential for military actions in the region to postpone/derail Wynn’s UAE project. Ultimately, we think the long-term potential remains despite the short-term disruption risk. Amazon also fell due to the conflict in the Middle East. The first-order effect on the company is higher fuel and shipping costs. Additionally, the potential for changes in consumer behavior due to price inflation has weighed on the stock. Again, we believe the long-term opportunity to grow revenue and profits at Amazon retail and cloud (AWS) remains despite the short-term disruption potential. The weakness in Microsoft shares was directly related to growth at Anthropic and Microsoft’s quarterly results commentary. Anthropic’s new product, Cowork, which can act as an autonomous agent, has been highly popular and may compete with some of Microsoft’s Copilot functionality. Microsoft also noted in their conference call that they are balancing compute resources between internal and external uses, effectively limiting growth in cloud (Azure) to invest in new AI products. Although we respect the innovation at Anthropic, we believe the installed base, research and development strength, and distribution capabilities at Microsoft will enable them to participate in Anthropic’s growth through partnership and will allow them to develop their own AI products. Importantly, later in the quarter, Microsoft announced that Anthropic Cowork will be offered alongside its Copilot products in the next Microsoft enterprise bundle. DraftKings’ stock weakened on bet volume (handle) growth and prediction market concerns. The company reported a solid Q4 25 but lowered its profit guidance for 2026 due to investments in its own prediction market products. As a quick reminder, prediction market players like Kalshi and Polymarket have been experiencing strong growth over the past year, sparking concerns that they are taking market share from existing online sports betting players like DraftKings. We added to the position as we think that handling growth deceleration has been driven by lower consumer win rates and lower promotions, and the prediction market growth has been and will continue to be a minor pressure to handle growth. Also, we believe that OSB players like DraftKings have a legitimate shot at developing their own prediction market business given their expertise in customer acquisition, product development, and market making. On the trim side, we lowered our position in TKO Holdings during the quarter. Although we continue to hold the company in high regard, the catalyst path that we identified at the initial investment has largely materialized. We took the opportunity to reduce the position size, as the stock has worked well since our purchase. We exited Vici Properties and Blackstone during the quarter. (Please see the Vici section above for an explanation for that exit.) We sold our Blackstone position due to the growing concerns over private credit. Like other alternative investment managers, Blackstone has exposure to private credit and software through its own BDC (Business Development Company) and other credit funds. And like other BDCs, Blackstone’s BDC has experienced elevated redemption requests recently. Although Blackstone has strong underwriting capabilities and will likely show solid credit performance, we expect broad fundraising activity to be pressured by lingering concerns over credit quality and valuation marks.
That’s the story for Q1 2026. Please reach out with any questions or comments.
Thank you for your continued support.
Holdings are current as of the date of this report and are subject to change without notice. Confidential and proprietary. For accredited investor use only. Not for distribution to the public.
The views of Sequoia Financial Advisors LLC expressed herein were current as of the date produced and are subject to change without notice. It should not be assumed that any recommendations will be profitable or will equal the performance of the securities or indexes described in this chart. Any performance data set forth herein represents past performance and such past performance is not an indicator of future results. An investment in this project is speculative and involves a high degree of risk. This investment is not intended to be a complete program. The performance may be volatile, and there is no assurance that it will achieve its investment objective. Investors could lose all or a substantial portion of their investment. Performance figures for ZCA Focus Fund, LP are shown at the fund level, net of fees and expenses. Actual investment fees will vary by client.
Performance figures for more than one year are cumulative. Performance figures for less than one year are cumulative. Past performance is not a guarantee of future results. All investments involve risk including the loss of principal. Benchmark returns are for illustrative purposes and include the reinvestment of dividends and income. One cannot invest directly in an index.
Top and bottom contributors are attributions of the stock itself and not performance of the actual fund.
Alternative investments generally possess risks greater than the risks of traditional investments. The underlying investments contained within liquid alternatives securities typically involve market risk, conflict of interest risk, higher fees, liquidity risk, less regulation, default risk, counter party risk, leverage risk, interest rate risk, manager risk, market timing risk, short-selling risk, diversification risk, and foreign exchange risk. Alternative investments are often more volatile than traditional investments such as stocks and bonds.
Investment advisory services offered through Sequoia Financial Advisors, LLC, an SEC Registered Investment Advisor. Registration as an investment advisor does not imply a certain level of skill or training.
The views expressed represent the opinion of Sequoia Financial Advisors, LLC. The views are subject to change and are not intended as a forecast or guarantee of future results. This material is for informational purposes only. It does not constitute investment advice and is not intended as an endorsement of any specific investment. Stated information is derived from proprietary and non-proprietary sources that have not been independently verified for accuracy or completeness. While we believe the information to be accurate and reliable, we do not claim or have responsibility for its completeness, accuracy, or reliability. Statements of future expectations, estimates, projections, and other forward-looking statements are based on available information and Sequoia’s view as of the time of these statements. Accordingly, such statements are inherently speculative as they are based on assumptions that may involve known and unknown risks and uncertainties. Actual results, performance or events may differ materially from those expressed or implied in such statements. Investing in equity securities involves risks, including the potential loss of principal. While equities may offer the potential for greater long-term growth than most debt securities, they generally have higher volatility. Past performance is not an indication of future results.
Performance results are presented both gross and net of investment advisory fees. The composite returns are time-weighted rates of returns and include the reinvestment of dividends and other earnings where possible, and are net of commissions, transaction costs and withholding taxes on foreign income and capital gains. Stock and ETF holdings that do not have a reinvestment options show dividends and other earnings paid in cash. Valuations and returns are calculated and expressed in U.S. Dollars. Gross performance does not reflect the deduction of management fees. Net of fee performance was calculated using a model advisory fee applied to the gross performance returns on a monthly basis. The model investment management fee utilized for these calculations was a 1.25% fee charged quarterly in advance based on the value of the investments within the clients’ account(s) on the last day of the previous quarter. Sequoia’s standard fee schedule currently ranges from 0.15% to 1.00%. Actual Results are based on fully discretionary accounts under management, including those accounts no longer with the firm. Actual investment management fees incurred by clients may vary.
This report may contain manually entered assets. Any information represented as manually entered assets should be regarded as informational only and not interpreted as a reflection of the investment’s current Net asset value. Asset dates represented from the most recent statement date. Manually entered assets are shown at original investment value, as provided by the management, administrator, or sponsor of each program, without independent verification by Sequoia Financial Advisors. Therefore, the estimated original investment values shown herein may not necessarily reflect actual market values or be realized upon liquidation. Please review and report any inaccuracies or discrepancies. Inquiries, concerns, or questions regarding any of your accounts or the activity therein should be directed to your financial advisor. This report may be based upon information and assumptions provided by you (the client). The consolidated report is provided for informational purposes as a courtesy to you. We recommend that you review your plan annually, unless changes in your personal or financial circumstances require more frequent review. While we have taken great care in the preparation of these materials, we cannot be responsible for clerical, computational, or other errors. It is important to compare the information on this report with the statements you receive from the custodian(s) for your account(s). Additional information regarding policies for valuing portfolios, calculating performance, and preparing compliant presentations, as well as additional Firm definition information, is available upon request.


")


")

U.S. Equities Surge to All-Time Highs as Iran Ceasefire Optimism Takes Hold