Insights
The Midterm Year Roadmap: What History Tells Us About 2026
by Sequoia Financial Group
by Sequoia Financial Group
As we move through 2026, many have asked a thoughtful and timely question: How is the U.S. stock market behaving relative to history, and what should we expect from a midterm election year? The early months of 2026 have been more turbulent than many investors anticipated—a sharp first-quarter rally gave way to a meaningful pullback as a result of geopolitical tensions in the Middle East, policy uncertainty, and a Federal Reserve leadership transition collided with the typical seasonal weakness historically associated with midterm election years.
The good news is this: While midterm years have historically been the most uneven phase of the four-year presidential cycle, they have also served as a launching point for some of the strongest 12-month forward returns on record. This letter walks through what the data tells us, where we stand today, and which factors are likely to shape the path forward.
The Midterm Year Pattern
Stock market behavior follows a remarkably consistent rhythm across the four-year presidential cycle.
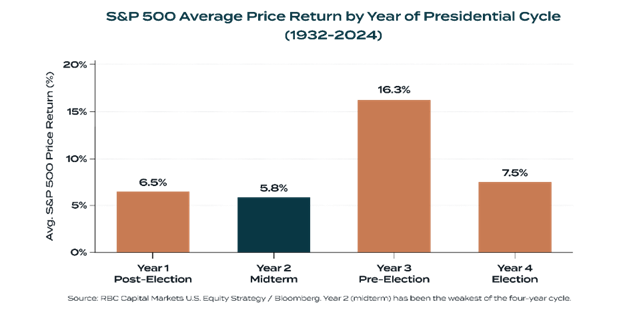
- Year One (post-election) tends to reflect policy implementation and modest gains.
- Year Two (the midterm year) has historically been the weakest and most volatile of the cycle.
- Year Three (pre-election) has typically been the strongest.
- Year Four (election year) has generally delivered solid, though often uneven, returns.
Since 1932, the S&P 500 has averaged roughly 5.8% during midterm years—the weakest annual return within the four-year presidential cycle. Yet the same data set shows an average gain of approximately 16.3% in the 12 months following a midterm election, representing one of the strongest forward-return periods in market history.1 Long-term S&P 500 data also shows that approximately 87% of midterm years have ultimately finished with positive full-year returns, even though the path to those outcomes has rarely been smooth.2
Why does this pattern persist? Three forces have historically tended to converge during the second year of a presidential term. First, much of the post-election policy optimism has already been priced into equities. Second, fiscal stimulus and tax-policy clarity, which often precede a midterm election, can compete with rising interest rates as growth expectations firm up. Third, the political uncertainty surrounding the midterm itself (control of Congress and the future of the administration’s agenda) introduces the type of volatility that markets typically dislike. Once that uncertainty begins to resolve, capital has historically been redeployed quickly.
Tracking the Historical Script
What is striking about this cycle is how closely the S&P 500’s path has tracked the long-term historical composite. We entered the year with a view that, thus far, proven correct: the second Trump administration’s aggressive fiscal and regulatory agenda lifted economic growth expectations, but much of that optimism was already reflected in market prices by the end of 2025. As 2026 began, the market appeared due for a period of consolidation, and the escalation of the U.S.-Iran conflict through March likely accelerated that consolidation phase by an estimated four to six weeks.
After a strong advance through January, the S&P 500 corrected from its early-year peak of roughly 7,000 into the mid-6,500s in late March before rebounding sharply through April. As of mid-May, the index sat at near 7,250, modestly positive year-to-date, while Wall Street’s median year-end target is around 7,650, implying approximately 11.8% full-year gains, modestly above the 30-year average.3
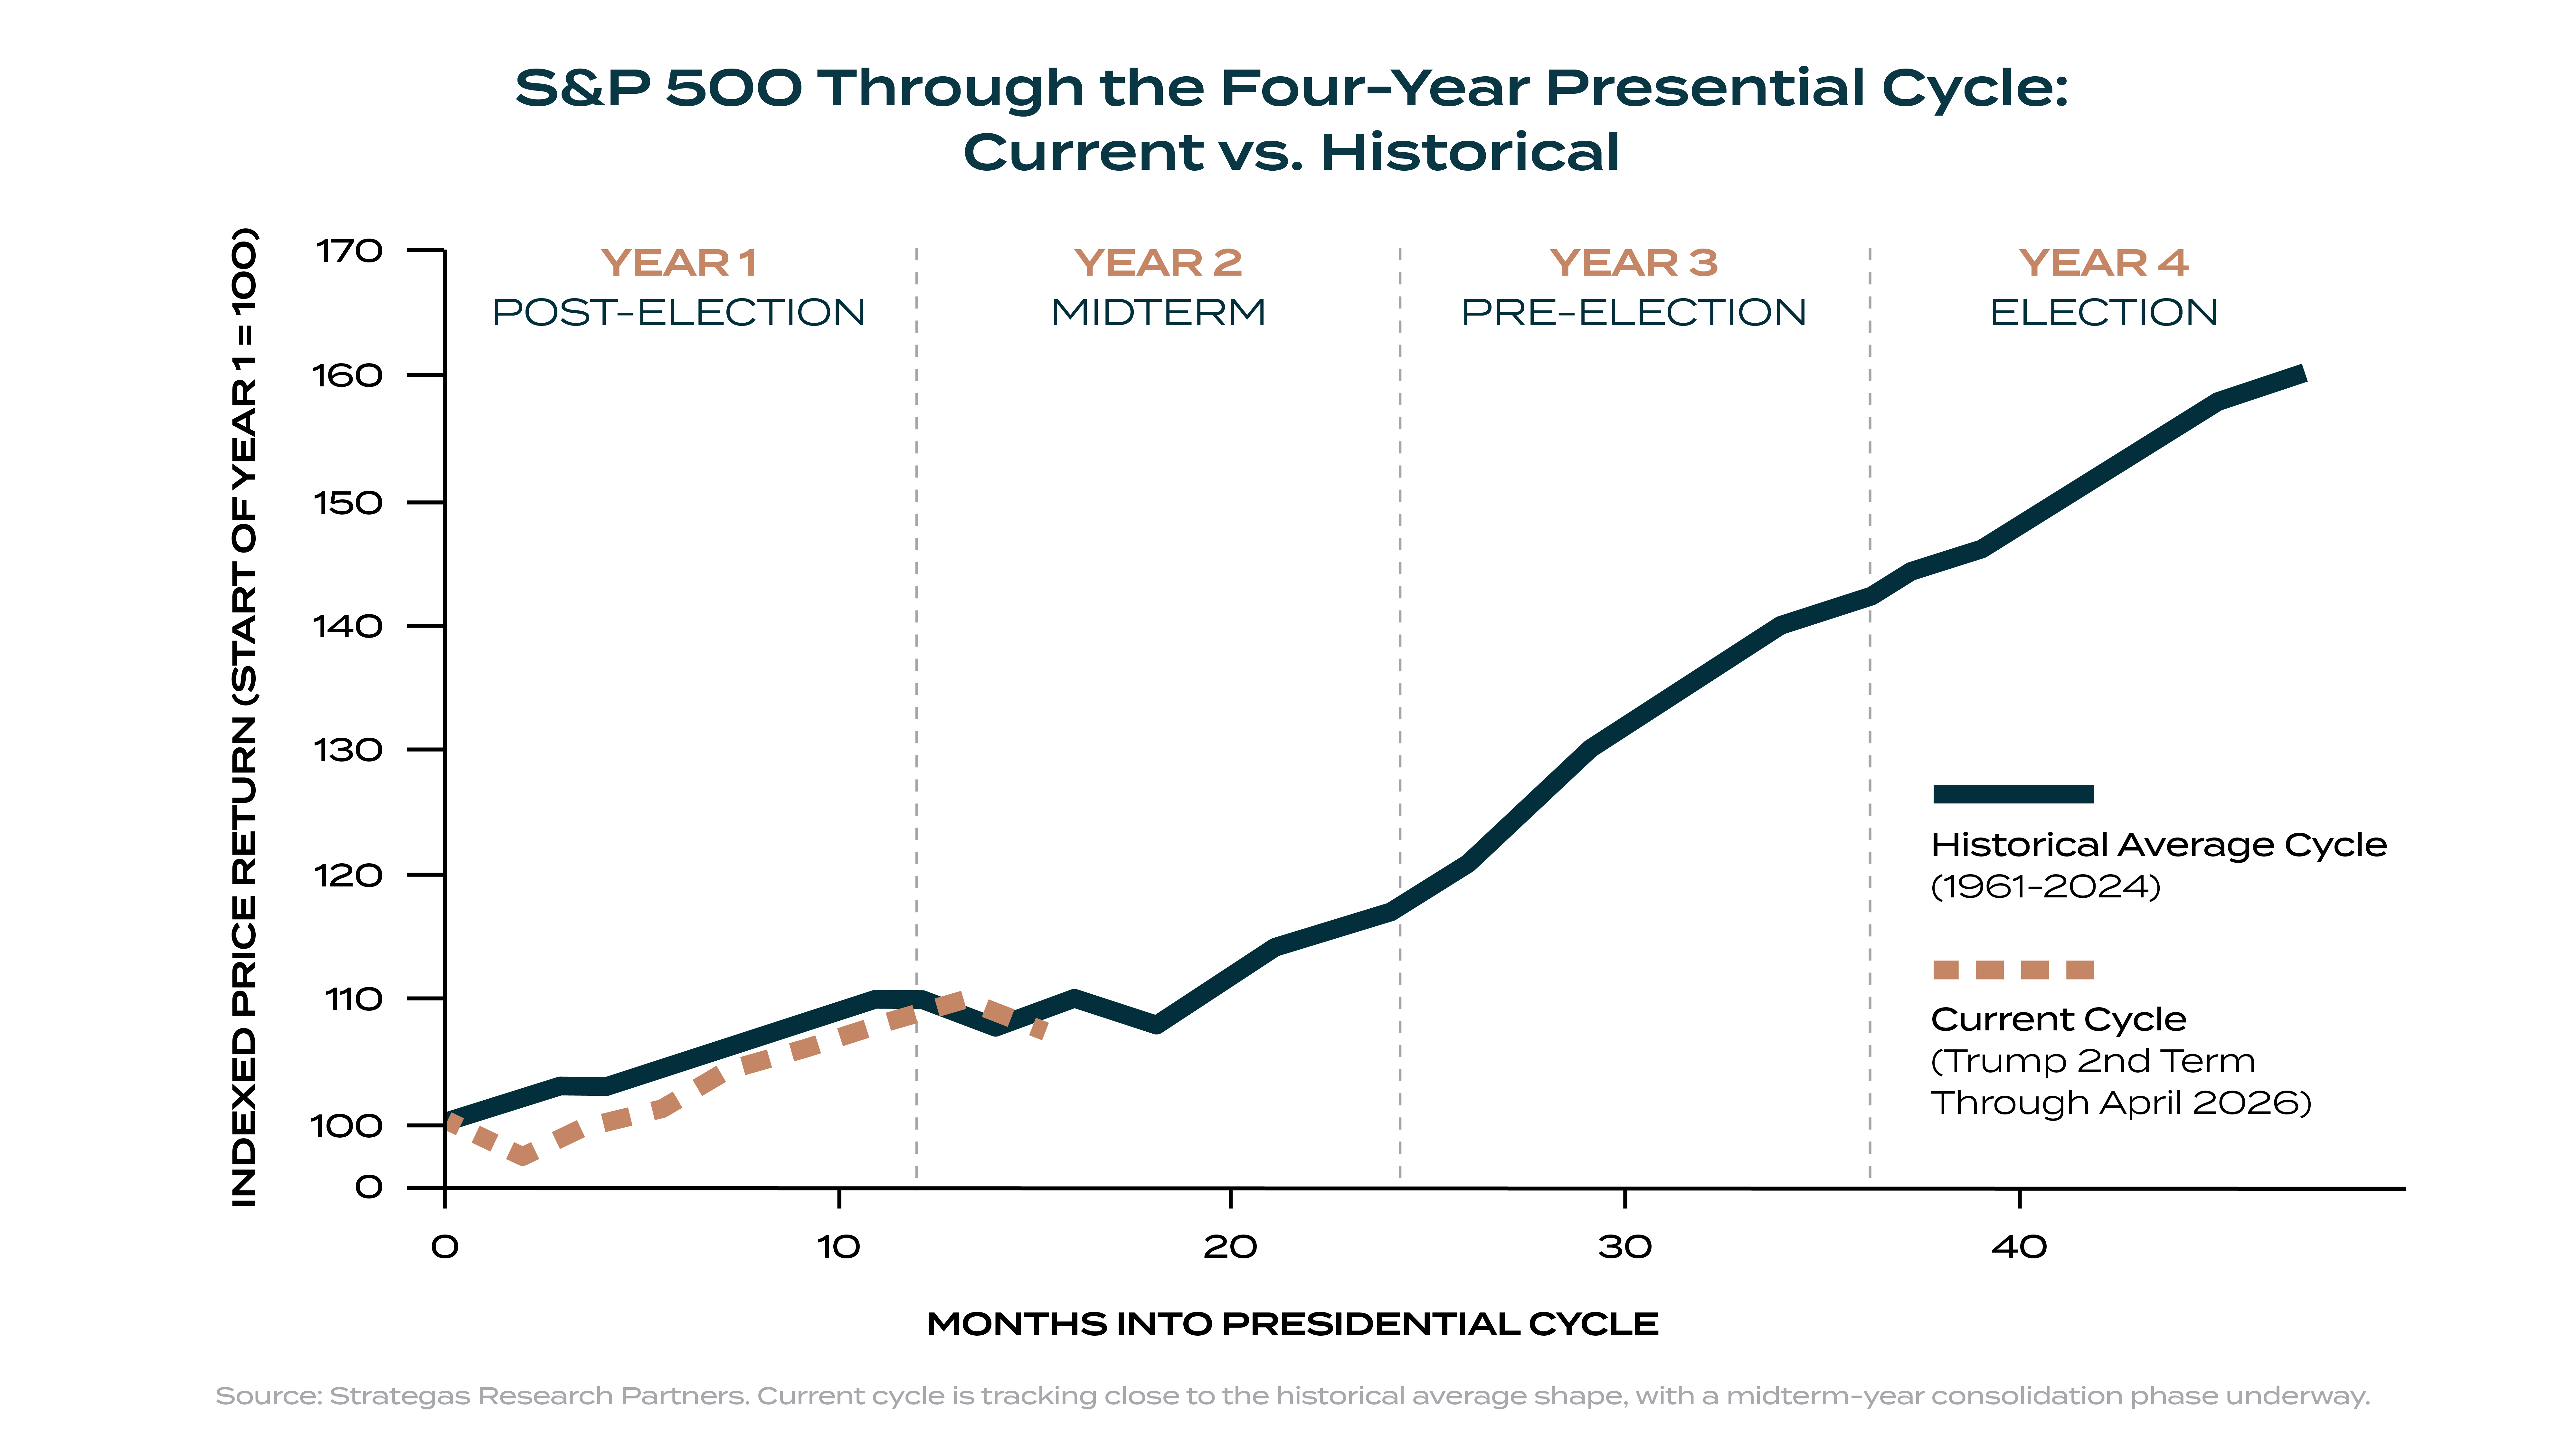
This is not a coincidence. The mechanics that have historically driven this cyclical pattern—fiscal policy stimulus ahead of midterms, the bond market pricing in stronger growth, and policy uncertainty peaking before the election—are all visibly at work today. The 10-year Treasury yield has closely tracked its historical midterm-year path, while value-versus-growth and equal-weight-versus-market-weight rotations have unfolded largely on schedule.4 The catalysts may be different this time—a Middle East conflict rather than a banking crisis or trade dispute—but the broader rhythm remains unmistakably familiar.
Drawdowns are the Price of Admission – and they are normal
If history is any guide, investors should expect additional turbulence before the year is over. The average intra-year drawdown during a midterm election year has historically been approximately 19%, substantially deeper than in other years of the presidential cycle. In 11 of the last 16 midterm years, the S&P 500 experienced a peak-to-trough decline of 15% or more at some point during the year.5
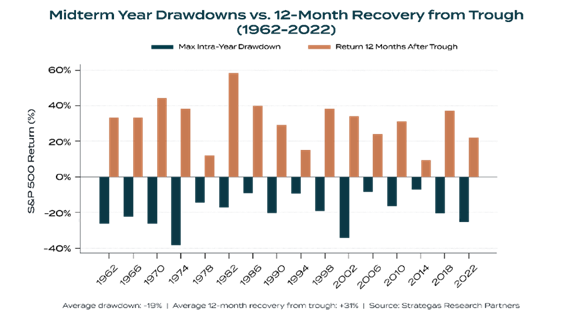
The more important observation, however, is what has historically tended to happen next. From the trough of the midterm-year correction, the S&P 500 has rallied an average of roughly 31% over the subsequent 12 months. That rebound has occurred in every one of the past 16 midterm cycles, with no negative outcomes over that forward period.5 It remains one of the more durable patterns in modern market history and reinforces why we caution against translating short-term volatility into long-term strategic changes. The data serves as evidence that volatility is the toll the market charges for its long-term returns. In midterm years, that toll is higher than usual, and the runway on the other side is longer than usual.
Determining Factors
Looking ahead, several key factors will likely shape how this midterm year ultimately resolves. We are monitoring each of them closely.
Geopolitical Resolution
The U.S.-Iran conflict has been the dominant source of volatility this spring. Oil prices and equity market sentiment are now closely tied to whether shipping through the Strait of Hormuz normalizes and whether the conflict broadens further. A diplomatic resolution would likely remove a meaningful overhang on equities. Continued escalation, particularly any disruption to global energy flows, would extend the current consolidation phase.
Federal Reserve Transition
Chair Powell’s term expired on May 15, and Kevin Warsh has since been confirmed as the next Federal Reserve chair. The question now is how the Fed under Warsh will interpret the inflation-versus-growth tradeoff during the second half of 2026, as that outlook will materially influence the path of future rate cuts.6 Markets are increasingly diverging from prior Fed expectations, a sign that recession concerns may be outweighing inflation concerns. A more dovish policy posture later this year would likely serve as a meaningful tailwind for risk assets.
Fiscal Policy and Corporate Earnings
The One Big Beautiful Bill Act (OBBBA) restored 100% expensing for capital equipment and R&D, a powerful incentive for capital investment that is already beginning to appear in the relative performance of beneficiary companies.7 Corporate earnings have also remained strong: 84% of S&P 500 companies reporting Q1 results have exceeded EPS estimates, marking the highest beat rate since 2021, while full-year 2026 earnings growth projected to exceed 21%.8 Corporate fundamentals remain supportive even as the macroeconomic backdrop grows noisier.
Policy Uncertainty as a Contrarian Signal
The U.S. Policy Uncertainty Index has climbed to levels last seen during the early-April tariff episode. Counterintuitively, history suggests that periods of unusually elevated policy uncertainty have often been followed by above-average S&P 500 returns over 3-, 6-, and 12-month periods. When the index has risen above 200, the average 12-month forward return for the S&P 500 has been approximately 17.8%, more than double the long-term average.9
What This Means for Portfolios
We want to be measured in the conclusions we draw. The midterm-year pattern is a historical tendency, not a guarantee, and the risks this year are real: a broader conflict in the Middle East, a policy misstep by the Federal Reserve, or a meaningful slowdown in earnings could all alter the path forward. At the same time, the weight of historical evidence across nine decades, multiple economic regimes, and every conceivable political configuration points in a clear direction. Midterm-year volatility has historically represented an opportunity, not a warning sign.
For Sentinel families, this informs three practical priorities as we move through the balance of the year: Stay invested through the noise. The cost of being out of the market during the post-midterm rebound, historically an average of approximately 31% from the trough, has far outweighed the cost of enduring additional volatility. We continue to favor a fully invested posture aligned with each family’s long-term strategic allocation.
Use volatility, do not fear it. Sharp drawdowns can create opportunities for tax-loss harvesting, Roth conversions at temporarily depressed valuations, and gifting strategies that transfer wealth under more favorable conditions. We are actively reviewing clients’ tax positions and will proactively reach out where these strategies may be appropriate.
Lean into the institutional-quality platform. Periods like this are precisely why we built Sequoia Sentinel Family Office around access to alternatives, private credit, structured solutions, and active manager selection. Diversification beyond public equities is doing meaningful work in client portfolios this year, and the growing dispersion across asset classes continues to underscore the value of an institutional approach to wealth management.
Closing Thoughts
Midterm election years are uncomfortable by design. They combine the most contentious phase of the political calendar with the weakest seasonal pattern in the equity market and a Federal Reserve often caught between competing pressures. 2026 has all of those ingredients, with an active geopolitical conflict and a Fed transition layered on top.
And yet, when we step back, the broader picture is more familiar than it may feel in any given week. The S&P 500 is tracking its historical cyclical path with remarkable precision. The same market that has navigated wars, oil shocks, banking crises, inflation, deflation, and virtually every political configuration imaginable over the last 90 years is doing what it has always done: pricing in uncertainty in the front half of the midterm year, while rewarding patient investors in the back half and beyond.
We will continue to monitor each of the factors outlined above and make adjustments where individual circumstances warrant. As always, please reach out to your Sentinel advisory team with any questions or if you would like to discuss the implications of the current environment for your specific situation.
Sources
- RBC Wealth Management, “Equities and the election effect.” Reports that since 1932, the S&P 500 has averaged a 5.8% price return in midterm election years and a 16.3% average gain in the 12 months following a midterm election. rbcwealthmanagement.com/insights/equities-and-the-election-effect
- Interactive Brokers Campus / Forecaster Terminal, “S&P 500 Seasonality and Presidential Cycles: What Historical Patterns Suggest for 2026.” Cites that midterm years have closed in positive territory in roughly 87% of cases in long-term S&P 500 data. interactivebrokers.com/campus/traders-insight
- Wall Street year-end 2026 S&P 500 price targets and consensus: The Motley Fool, “Wall Street Says the Stock Market’s Return in 2026 Will Beat the 30-Year Average” (April 25, 2026), citing a median target of 7,650 across 21 firms and a year-to-date starting level of 6,845; CNBC Pro Market Strategist Survey (median 7,675, average 7,654); Yardeni Research updated target of 8,250 (May 2026); J.P. Morgan target of 7,600 (April 21, 2026). fool.com/investing/2026/04/25, cnbc.com
- Strategas Research Partners, Policy Outlook, “S&P 500 Pattern in 2026 Looks Nearly Identical to the Historical Average” (March 30, 2026). Includes overlay of the current cycle vs. 1961–2024 four-year cycle average, the 10-year Treasury yield indexed path, and the value vs. growth and market-weight vs. equal-weight rotations through midterm cycles. strategasrp.com
- Strategas Research Partners, Policy Outlook (March 30, 2026), “Average Intra-Year Decline in a Midterm Election Year Is 19%, Higher Than in the Other Years.” The chart of 16 midterm cycles from 1962 through 2022 shows an average peak-to-trough drawdown of -19% and an average 12-month return from the trough of +31%, with positive recoveries in all 16 cycles. strategasrp.com
- Strategas Research Partners, Policy Outlook (March 30, 2026), “Senate Banking Committee Eyes Warsh Hearing Despite No Deal on DOJ’s Powell Lawsuit.” Discusses Powell term expiration on May 15, the Warsh nomination timeline, and the Senate confirmation outlook. Polymarket betting odds also referenced. strategasrp.com; polymarket.com
- Strategas Research Partners, Policy Outlook (March 30, 2026), “Companies Levered Up to 100% Expensing of Capital Equipment & R&D Are Outperforming.” Discusses the One Big Beautiful Bill Act (OBBBA) restoration of 100% expensing and the relative performance of beneficiary companies. strategasrp.com
- FactSet Earnings Insight (S&P 500 Earnings Season Update, May 8, 2026). Reports 84% of S&P 500 companies have reported a positive EPS surprise for Q1 2026 — the highest beat rate since Q2 2021 — and projects calendar-year 2026 earnings growth of 21.0%. Additional confirmation: Fortune, “84% of S&P 500 companies beat earnings estimates this quarter” (May 5, 2026). insight.factset.com; fortune.com
- Strategas Research Partners, Policy Outlook (March 30, 2026), “S&P 500 Returns Following Spikes in US Policy Uncertainty,” using the daily US Policy Uncertainty Index (January 1985 – March 29, 2026). When the index registers above 200, the average S&P 500 12-month forward return has been 17.8%; underlying data from policyuncertainty.com. strategasrp.com; policyuncertainty.com
METHODOLOGY NOTES
Exhibits 1, 2, and 3 in this letter are Sentinel-produced charts built from the underlying data sources cited above. Exhibit 1 uses RBC / Bloomberg long-term S&P 500 price return data by year of presidential cycle. Exhibits 2 and 3 reproduce the underlying data from the Strategas Research Partners Policy Outlook (March 30, 2026), with chart styling adapted to the Sequoia Sentinel brand. The current-cycle (Trump 2nd Term) overlay in Exhibit 2 is indexed to January 2025 = 100 and reflects S&P 500 price-only returns through April 2026. References to “the 30-year average” in the letter use the trailing 30 calendar years of S&P 500 price-only returns through year-end 2025.
The views expressed represent the opinion of Sequoia Financial Group. The views are subject to change and are not intended as a forecast or guarantee of future results. This material is for informational purposes only. It does not constitute investment advice and is not intended as an endorsement of any specific investment. Stated information is derived from proprietary and nonproprietary sources that have not been independently verified for accuracy or completeness. While Sequoia believes the information to be accurate and reliable, we do not claim or have responsibility for its completeness, accuracy, or reliability. Statements of future expectations, estimates, projections, and other forward-looking statements are based on available information and Sequoia’s view as of the time of these statements. Accordingly, such statements are inherently speculative as they are based on assumptions that may involve known and unknown risks and uncertainties. Actual results, performance or events may differ materially from those expressed or implied in such statements. Investing in equity securities involves risks, including the potential loss of principal. While equities may offer the potential for greater long-term growth than most debt securities, they generally have higher volatility. Past performance is not an indication of future results. Investment advisory services offered through Sequoia Financial Advisors, LLC, an SEC Registered Investment Advisor. Registration as an investment advisor does not imply a certain level of skill or training.
The views expressed represent the opinion of Sequoia Financial Group. The views are subject to change and are not intended as a forecast or guarantee of future results. This material is for informational purposes only. It does not constitute investment advice and is not intended as an endorsement of any specific investment. Stated information is derived from proprietary and nonproprietary sources that have not been independently verified for accuracy or completeness. While Sequoia believes the information to be accurate and reliable, we do not claim or have responsibility for its completeness, accuracy, or reliability. Statements of future expectations, estimates, projections, and other forward-looking statements are based on available information and Sequoia’s view as of the time of these statements. Accordingly, such statements are inherently speculative as they are based on assumptions that may involve known and unknown risks and uncertainties. Actual results, performance or events may differ materially from those expressed or implied in such statements. Investing in equity securities involves risks, including the potential loss of principal. While equities may offer the potential for greater long-term growth than most debt securities, they generally have higher volatility. Past performance is not an indication of future results. Investment advisory services offered through Sequoia Financial Advisors, LLC, an SEC Registered Investment Advisor. Registration as an investment advisor does not imply a certain level of skill or training.
Investment advisory services offered by Sequoia Financial Advisors, LLC. Registration as an investment advisor does not imply a certain level of skill or training.
This material is for informational purposes only and is not intended to serve as a substitute for personalized investment advice or as a recommendation or solicitation of any particular security, strategy or investment product. Diversification cannot assure profit or guarantee against loss. There is no guarantee that any investment will achieve its objectives, generate positive returns, or avoid losses. Sequoia Financial Advisors, LLC makes no representations or warranties with respect to the accuracy, reliability, or utility of information obtained from third-parties. Certain assumptions may have been made by these sources in compiling such information, and changes to assumptions may have material impact on the information presented in these materials. Sequoia Financial Advisors, LLC does not provide tax or legal advice.

 (1)")


")

")

")
Momentum Trade Moves into Bear Market Territory