Market Commentary
Q1/24 Review: Market & Economic Momentum Persists
by Sequoia Financial Group
by Sequoia Financial Group
It’s been two years since the Fed embarked on one of history’s most aggressive interest rate-hiking campaigns. Despite policymakers’ efforts to slam the brakes on the U.S. economy to suppress inflation, we have avoided a hard landing, with the labor market and consumption activity holding firm. This economic backdrop set the stage for another strong quarter of equity performance. The S&P 500 returned ~10% in the first quarter of 2024, with all major U.S. equity benchmarks (the Dow Jones Industrial Average, NASDAQ, and S&P 500) reaching new all-time highs.
Meanwhile, inflation remains stubbornly elevated, leaving the Fed in an unenviable situation. Policymakers want to start cutting rates this year, but not if it would risk reaccelerating inflationary trends. Q1/24 inflation data came in hotter than anticipated, forcing the market to scale back the number of rate cuts projected for 2024. Looking at previous periods when the Fed was on hold shows that the current pause now ranks second in duration at 249 days. The good news is that the longer the Fed holds, the higher the market has historically moved. During periods in which the pause exceeds 100 days the market is up on average 13%; when the pause is less than 100 days, the market on average is down. The best performance occurred during the 2006/2007 pause, which was also the longest and resulted in the S&P 500 rising 22%.
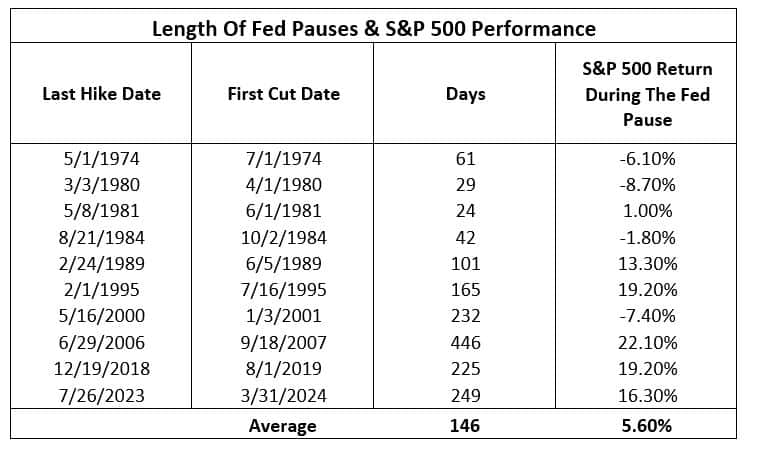
Source: Bloomberg/Strategas
The S&P 500 has returned 16.3% since the last time the Fed hiked interest rates (07/25/23). It is important to note that such market behavior is completely rational! The equity market behaved worse in periods when the Fed had to react quickly to a deteriorating set of economic conditions. This is quite the opposite of what we are observing today, as economic conditions continue to defy skeptics waiting for the bottom to fall out of the economy.
As illustrated in the charts below, credit spreads for corporate debt have compressed to near-record lows, and the equity multiple continues to expand – a sign that market sentiment remains constructive for risky assets.
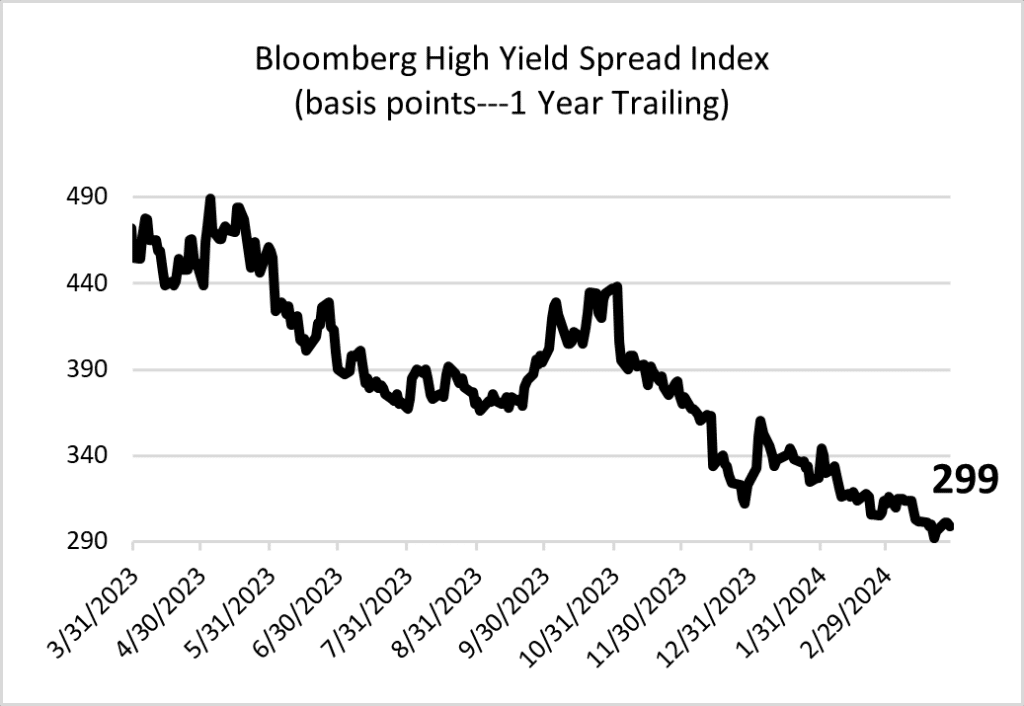
Source: Bloomberg
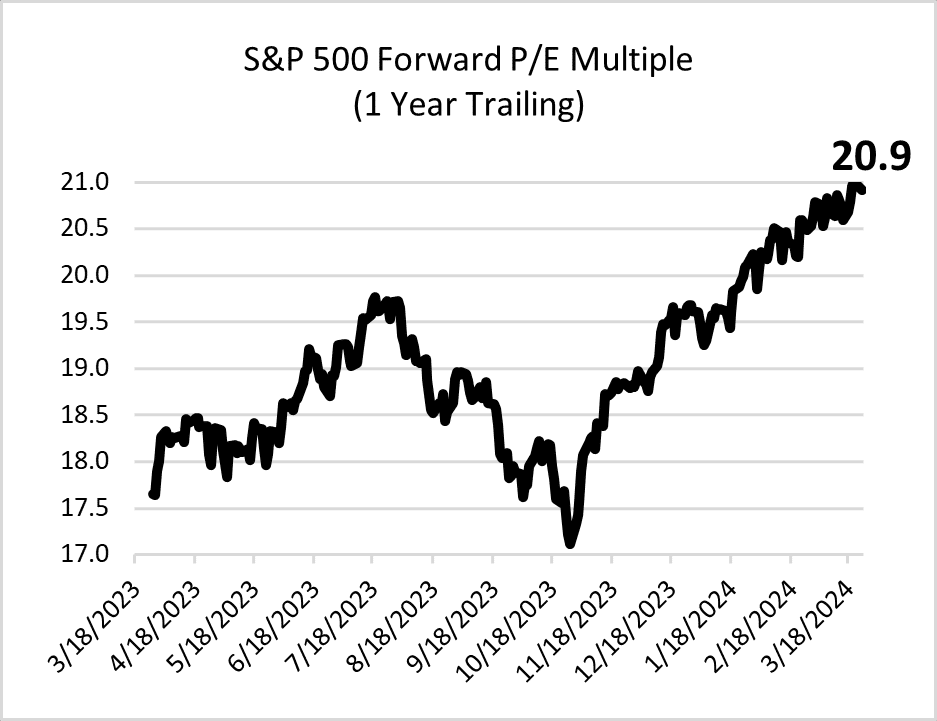
Source: Bloomberg
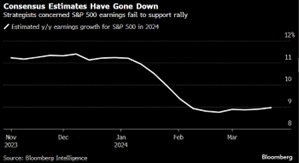
The 20.9x forward P/E valuation of the S&P 500 is now markedly higher than its historical average of ~16.5x. The market price has moved ahead of earnings, putting much pressure on earnings growth to meet forecasts. Full-year earnings growth estimates have come down from 11% to 9% since January, but that’s been good enough for investors that have been captivated by growth themes like artificial intelligence and weight-loss drugs. The momentum behind these themes has taken on a life of its own as investors try to keep pace with what continues to be a concentrated market.
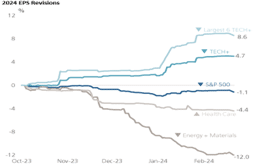
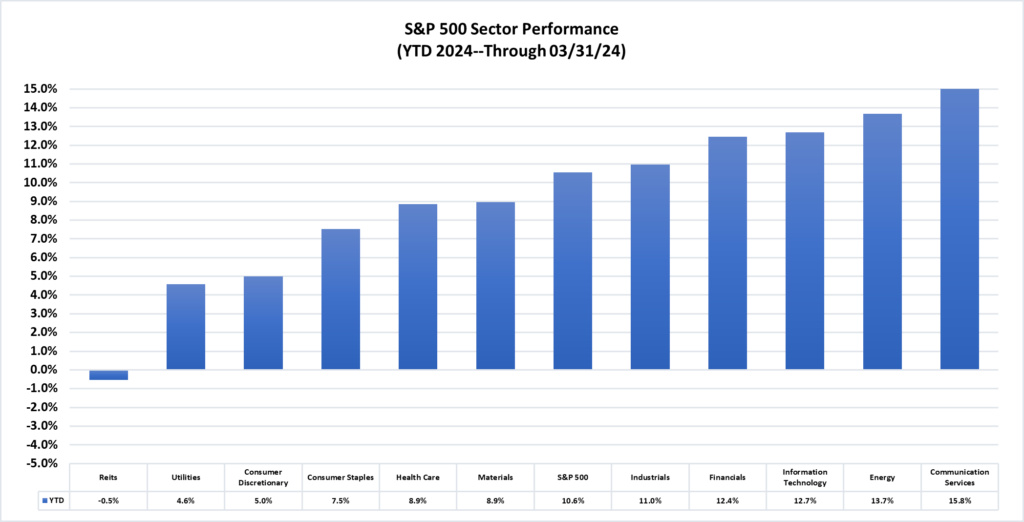
The positive earnings revisions we’ve observed this year continue to favor large-cap information technology, the clear leader of the equity market. The S&P 500 has advanced handsomely since late October, led by the six largest TECH+ stocks (NVDA, META, AMZN, MSFT, GOOG, AAPL). The data indicates that the market’s advance and narrow leadership are justified, given the strength in earnings revisions over this period. The consensus EPS growth expectation for 2024 for this cohort of stocks is 26.3%, vs. 6.1% for the rest of the S&P 500. The top five largest stocks dominated the market in 2023 and are doing so again so far this year, accounting for around half of its return. So, equity market performance remains fairly concentrated, but some of the most influential names have changed. At the same time, it’s fair to suggest that the U.S. equity market has broadened from a performance perspective. As the chart below shows, five sectors are now outperforming the total index with only REITs, the most interest rate-sensitive sector, showing negative returns YTD. More than half of the stocks in the S&P 500 have notched 52-week highs.
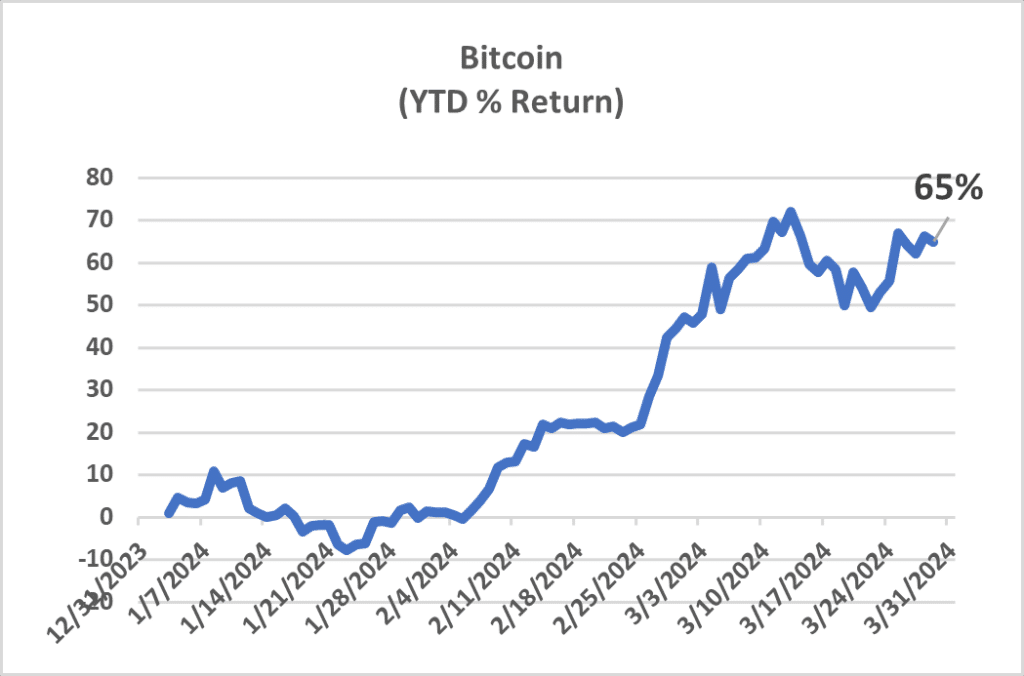
Bitcoin fans often refer to the world’s most valuable cryptocurrency as “digital gold,” a new store of value for the modern age. Bitcoin closed the quarter near its all-time high at ~$70,000. There are several reasons for this, the most obvious of which is that the U.S. regulator approved Bitcoin ETFs (exchange-traded funds that can hold Bitcoin). U.S. investors can now get exposure to Bitcoin without having to navigate suspect exchanges or cold wallets, and all with the sense that it has some level of institutional approval.
Further, Bitcoin is approaching another “halving” (which in essence reduces the supply of new coins) and, historically, that has boded well for the price. Another reason is that tech mania appears to have gripped the U.S. stock market again, and Bitcoin has generally done well when the NASDAQ does well.
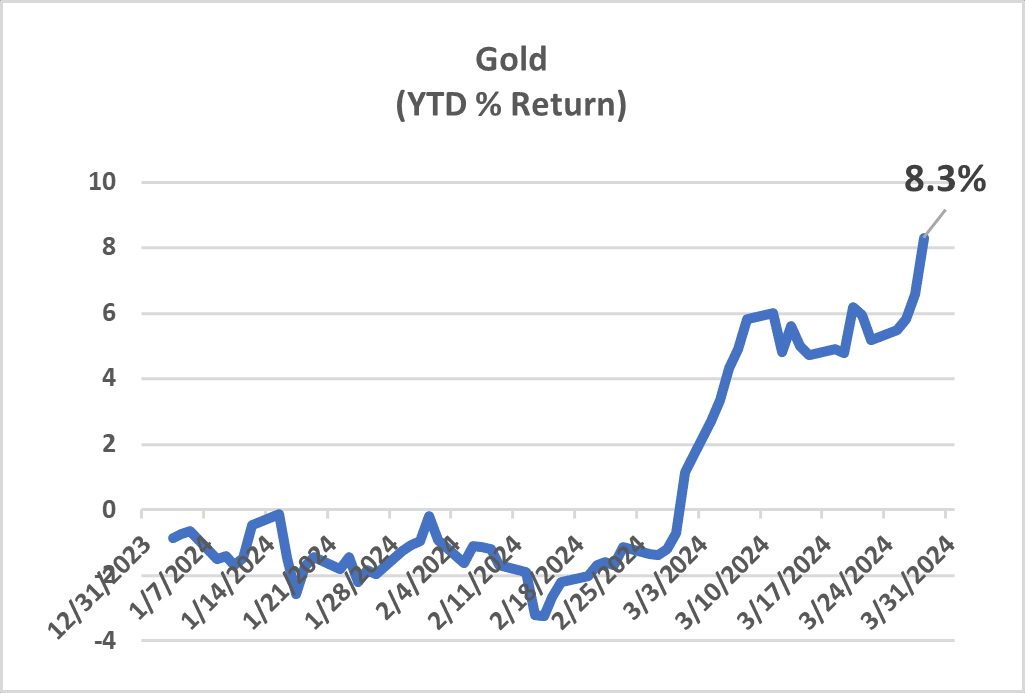
But gold hasn’t been a slouch of late, either. The yellow metal is now trading above $2,200/ounce and is also at a record high. This is a bit curious. For one, inflation pressures are starting to recede so there shouldn’t be a compelling case to buy gold as a hedge against rising prices. Though both gold and Bitcoin also tend to get a boost during times of significant dollar weakness, the U.S. Dollar Index is up more than 3% this year. Perhaps general angst about global events, such as the Russia-Ukraine war, the Israel-Hamas military conflict, and recent attacks by Yemen’s Houthis on cargo ships in the Red Sea, are contributors to the twin rallies in gold and Bitcoin? It could also be that gold, commodities and real assets are beginning to reflect the probability that inflation will stay elevated as the Fed chooses easier monetary policy instead of skyrocketing interest expense.
Q1 Bond market weakness can be explained rather easily by the increase in interest rates we’ve observed across the curve since the beginning of the year. Interest rates have responded to higher-than-expected levels of both economic growth and inflation. The explanation for the strength in equities this year may be as simple as it is surprising: eye-popping liquidity from central banks. While the Fed is still on a quantitative tightening campaign (Q.T. – reducing the size of its balance sheet), other central banks are continuing to pump liquidity into the global economy. Aggregate liquidity from the official sector has surged in recent months, largely thanks to the Bank of Japan (BOJ) buying domestic government bonds to keep its “yield curve control” policy intact and to stimulus from the People’s Bank of China (PBOC). The BOJ bought $291 billion of bonds in January – a monthly record that contributed to G4 central banks’ first net injection of liquidity into the global financial system since last April.
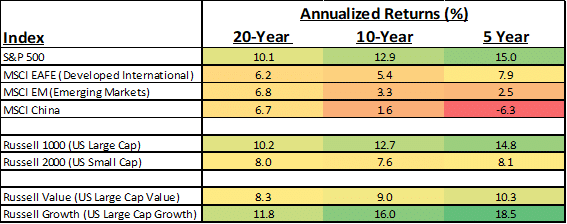
It’s been a strong start to the year for equities but, like last year, returns can vary significantly based on where one is invested in the market. For example, large-cap U.S. stocks (as measured by the Russell 10000) are up 10.3% year to date versus small-cap stocks (as measured by the Russell 2000) up only 5.2%. Higher interest rates thus far in 2024 have worked against smaller companies that rely on debt to finance growth. In a continuation of what’s been a long-term trend, emerging market equities, weighed down by China weakness, are again underperforming global equities. Through the end of Q1, Chinese equities have a 5-year annualized return of -6.3% versus the S&P 500 +15.0%. U.S. large-cap growth stocks are up 18.5% per year over the last five years.
Americans May Have to Learn to Deal with Scarcity
The Federal Reserve has a set of policy tools that influence the aggregate demand for goods and services in the U.S. economy. For instance, increasing interest rates reduces the affordability of goods that require financing and, therefore, has a negative impact on economic activity, putting downward pressure on prices. However, when it comes to managing inflation, the Fed has no control over another vital component of the equation: the supply of goods and services in the economy. This puts meaningful limitations on monetary policy’s efficacy in the fight against inflation.
The raging waves of inflation observed in the 1970s and 1980s were primarily sparked by the limited and inconsistent supply of oil. Much of the recent post-COVID spike in inflation was driven by the bottlenecks in the global supply chain of goods and services. Remember those vessels piled up at the ports, unable to get goods in heavy demand to market? Inflation started to come down when supply and demand came back into equilibrium.
During most of our lifetimes, most goods and services have been plentiful. However, we might be entering an era in which not everything is so abundant, and both consumers and businesses will need to make choices. The reality of scarcity has already affected labor, housing, drug supplies, insurance policies, and electricity generation.
| Labor | Personnel shortages have become a real problem within the education, medical, airline, construction, and semiconductor sectors. Global population growth has turned negative. |
| Food | Declining domestic production has left the U.S. with a $19 billion food trade deficit. |
| Housing | According to the Federal Home Loan Mortgage Corporation (Freddie Mac), the U.S. currently has a 3.2 million housing unit shortage. |
| Raw Materials | Export restrictions on critical raw materials have increased five-fold since the OECD began collecting data in 2009. |
| Insurance | The price that reinsurance companies charge insurance companies recently increased by 40% with growing damages from storms and the effects of global warming/climate volatility. |
| Electricity | The North American Electricity Reliability Corporation (NERC), a non-profit that oversees the reliability of power grids, issued a warning this past summer that 2/3 of the continent faces elevated risk of electricity shortfalls. |
As a result, taming inflation may be more complex than previously thought. With this structural shift in supply dynamics, the Fed could struggle to control long-term inflation expectations. We should expect to see higher prices if we are in fact moving into an era of limits.
Historically, the U.S. consumer never had to make scarcity decisions. Americans had more than enough of everything, and they exported their surplus to the rest of the world. Perhaps the pinnacle of production and affluence has started to weaken.
Is The Economy Too Strong to Maintain Disinflationary Trends?
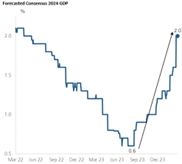
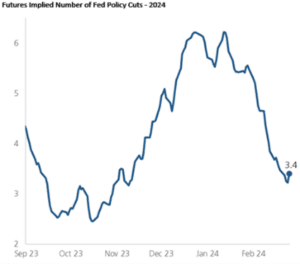
The disruption of the progress around inflation is one of the most significant risks to financial markets in the near term. Thus far in 2024, economic activity has outpaced expectations, and economic growth projections have reaccelerated. GDP growth forecasts for 2024 have spiked alongside inflation expectations. This begs the question of whether the data is too strong to support a disinflationary trend. The market is banking on the Fed easing interest rate policy in 2024. Per the chart below (far right) the futures market had factored in over six interest rate cuts of 25 basis points each for all of 2024, but has since reassessed the number of cuts needed considering stronger-than-expected economic growth and inflation data.
Source: UBS
Despite the flattening of disinflation trends this year, Jerome Powell reiterated his confidence in the Fed’s ability to get core inflation readings down to 2% over time. It may be harder to get to 2% this cycle than policymakers expect. As the chart below shows, an examination of prior inflationary regimes suggests that a second wave of inflation is quite normal.
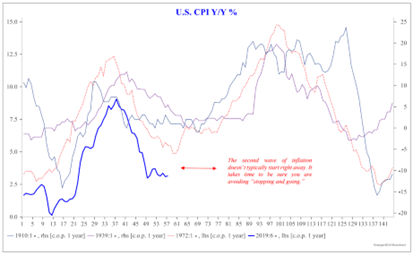
Source: Strategas
The market is not positioned well for a second wave of inflation. Any reacceleration would influence the path of Fed policy and send long-term interest rates higher, negatively impacting market valuation multiples. While we are not terribly concerned about the likelihood of runaway inflation, we could see inflation settling at a higher level than policy makers would like.
Recessionary Fears Have Mostly Disappeared
Employers are still hiring, unemployment is still below 4%, and consumers – the backbone of U.S. economic strength – are still spending. Though we expect a deceleration in consumer activity, it will take a weaker labor market to impair consumer confidence in a meaningful way.
We may have averted a hard landing, but we could nonetheless see a mild recession due to the worsening employment picture, which could affect those areas that have ramped up on continued employment growth and solid spending. Corporate pricing power is fading, but costs remain elevated. This dynamic could squeeze corporate profit margins, incentivizing businesses to cut costs. In previous cycles this cost cutting has been centered around labor, often causing the unemployment rate to jump dramatically. Per the chart below, it’s not unusual to observe sharp spikes in unemployment from very low levels.
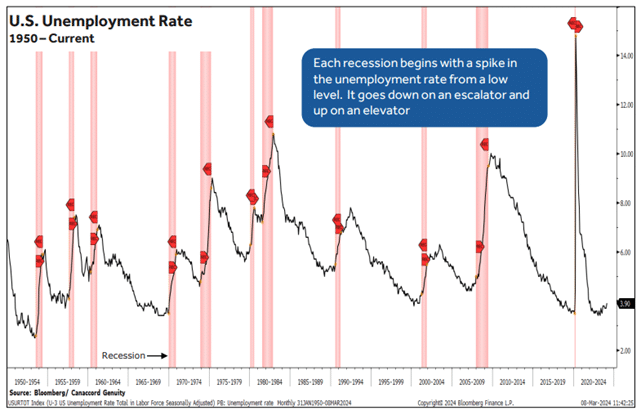
Market participants and policymakers alike will be acutely focused on labor market trends to help assess the continued resilience of the U.S. consumer this year.
Conclusion
The U.S. economy continues to defy expectations. Recession worries have mostly disappeared. Robust corporate profits, enthusiasm around developments in artificial intelligence and hopes that the Federal Reserve is on track to begin cutting interest rates have given investors plenty of reasons to continue buying. Stocks could quicky appear overvalued if companies fail to deliver expected profits. Companies in the S& P 500 are trading around 21x their projected earnings over the next 12 months, well above historical average valuations, according to FactSet.
Market prices are more volatile than underlying values. Per the chart below, the price of the S&P 500 has acerated well above the trend of earnings growth. It’s fair to question whether the underlying strength of corporate profits can keep pace with investor optimism. Earnings are the long-term fundamental basis of valuation for equity markets. If fundamentals do not catch up, the positive momentum in the markets today can reverse sharply. For that reason, markets appear susceptible to a correction.
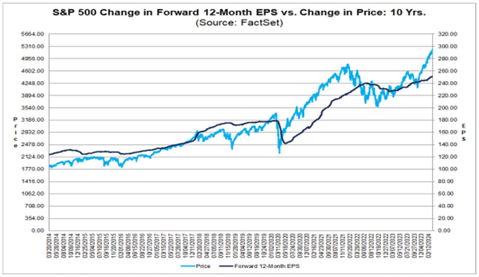
Source: FactSet
After a material reduction in long-term interest rates from last year’s highs, we now believe the risks are more balanced in the near term. We therefore are taking a less aggressive approach with respect to duration in our fixed-income portfolio. Our updated fixed-income allocations will be less reliant on interest rates to drive performance. Yields are at attractive levels not seen in more than a decade. We are delivering a mix of high-quality fixed-income managers with an average yield in the 6.5% range. It is significant that we don’t need to reach deep into credit to achieve these yields in the portfolio. Also, the yield profile provides greater cushion for any unexpected rise in interest rates.
The views expressed represent the opinion of Sequoia Financial Group. The views are subject to change and are not intended as a forecast or guarantee of future results. This material is for informational purposes only. It does not constitute investment advice and is not intended as an endorsement of any specific investment. Stated information is derived from proprietary and nonproprietary sources that have not been independently verified for accuracy or completeness. While Sequoia believes the information to be accurate and reliable, we do not claim or have responsibility for its completeness, accuracy, or reliability. Statements of future expectations, estimates, projections, and other forward-looking statements are based on available information and Sequoia’s view as of the time of these statements. Accordingly, such statements are inherently speculative as they are based on assumptions that may involve known and unknown risks and uncertainties. Actual results, performance or events may differ materially from those expressed or implied in such statements. Investing in equity securities involves risks, including the potential loss of principal. While equities may offer the potential for greater long-term growth than most debt securities, they generally have higher volatility. Past performance is not an indication of future results. Investment advisory services offered through Sequoia Financial Advisors, LLC, an SEC Registered Investment Advisor. Registration as an investment advisor does not imply a certain level of skill or training.
Alternative investments generally possess risks greater than the risks of traditional investments. The underlying investments contained within liquid alternatives securities typically involve market risk, conflict of interest risk, higher fees, liquidity risk, less regulation, default risk, counter party risk, leverage risk, interest rate risk, manager risk, market timing risk, short-selling risk, diversification risk, and foreign exchange risk. Alternative investments are often more volatile than traditional investments such as stocks and bonds.
Cryptocurrencies are not generally backed or supported by any government or central bank. Their value is completely derived by market forces of supply and demand, and they are more volatile than traditional currencies. The value of cryptocurrency may result in the potential for permanent and total loss of value of a particular cryptocurrency should the market for that cryptocurrency disappear. Cryptocurrencies are not covered by either FDIC or SIPC insurance. Legislative and regulatory changes or actions at the state, federal, or international level may adversely affect the use, transfer, exchange, and value of cryptocurrency. Purchasing cryptocurrencies comes with a number of risks, including volatile market price swings or flash crashes, market manipulation, and cybersecurity risks. In addition, cryptocurrency markets and exchanges are not regulated with the same controls or customer protections.
Investment advisory services offered through Sequoia Financial Advisors, LLC, an SEC Registered Investment Advisor. Registration as an investment advisor does not imply a certain level of skill or training. Information about Sequoia can be found within Part 2A of the firm’s Form ADV, which is available at https://adviserinfo.sec.gov/firm/summary/117756

")


")

")

")
Equities Extend Losing Streak as Iran Conflict Roils Markets